Discover the magic of professional photo editing with our collection of Lightroom Presets.
From boutique inns, grand resorts to Airbnbs, discover strategies that boost bookings and enhance guest loyalty in a crowded market.
Our expert articles cover everything from the fundamentals of camera settings to various photography styles.
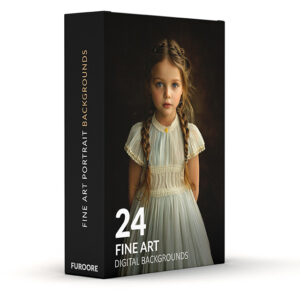
Latest FRom the SHop
-67%


$79.90


$39.90
-29%

-47%


$99.90
our latest articles


Don't miss out on this


Beginner Photography most popular:
How to Start Photography for Beginners
DSLR or Mirrorless System Camera for Beginners?
How to use Portrait vs Landscape Format in Photography
Camera White Balance Explained for Beginners
Best Camera Mode Settings Explained for Beginners
More about Furoore
Furoore is a dynamic and comprehensive platform designed to empower and equip content creators, marketers, and photographers with the tools, tips, and solutions they need to excel in their respective fields.
With a focus on enhancing productivity and streamlining workflows, Furoore offers a wide array of resources tailored to meet the unique requirements of its diverse user base.
From business owners and bloggers to influencers and passionate content creators, Furoore provides an extensive array of resources to refine skills and enhance creative endeavors.
The platform is meticulously crafted to offer advanced solutions and handy plugins that cater to the specific needs of its users, thereby facilitating a smoother and more efficient creative process.
In addition to its range of tools and solutions, Furoore also features a magazine that serves as a rich source of information and inspiration. This section is filled with valuable tips and tricks for optimizing content for various platforms, including social media.
We also provide insightful advice on building and growing an online presence, keeping users informed about the latest trends, best practices, and emerging techniques in the digital landscape.